
I’ve been in talent and people leadership roles long enough to know that hiring never feels simple—especially when the conditions keep changing. Economic slowdowns, unpredictable job market shifts, and the government shutdown delaying the release of official labor data mean it’s harder than ever to know what “good” actually looks like in recruiting right now.
That’s why I’m so excited about the launch of Employ’s new Hiring Benchmarks Report. We analyzed real hiring data from 6,640 customers using Employ’s talent acquisition software—Jobvite, Lever, JazzHR—to help you pinpoint where you’re lagging, leading, and right on track.
In this blog, I’ve pulled one standout benchmark from each hiring stage—attract & engage, screen, interview, select, and onboard—so you get a clear snapshot of what the data reveals and how to use it. You’ll see the key metric, what it means, and suggested next steps you can take to move the needle in 2026.
Let’s dive in.
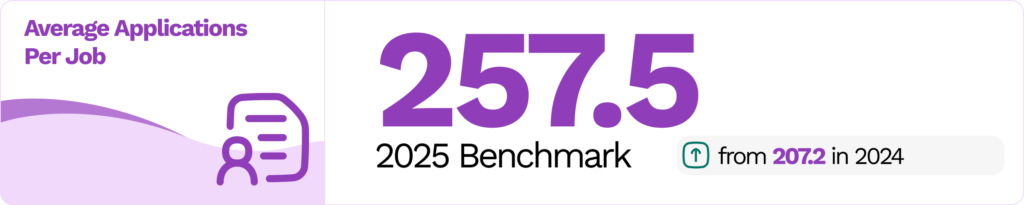
Metric #1: Average Applications Per Job
The average number of applicants per open role tells you how well your employer brand, job visibility, and candidate sourcing tools are working together to pull talent into your pipeline.
By the Numbers
What’s Happening
Our benchmark data echoes what we saw in this year’s Recruiter Nation Report: applicant volume is surging across the board—organizations are seeing roughly 50 more applicants per role than last year.
Broken down by company size, small businesses lead with 312 applications per job, largely because they recruit for broader roles that require more general skill sets—widening the qualified talent pool. Enterprise organizations (208.1), on the other hand, tend to hire more specialized or senior roles promoted in niche channels, which naturally limits volume.
Industry tells a similar story. Software & tech roles see the highest volume (369.1 per job) thanks to remote work options and flexible location requirements. But for industries like hospitality (202.9) and manufacturing (176.4)—where most roles require onsite presence—the talent pool is simply more localized, and the applicant count reflects that.
What to Do Next
- If your number is above the benchmark: Focus on quality over quantity by tightening targeting and using AI screening tools to surface better fits faster.
- If your number is below the benchmark: Audit where and how you post, refresh job titles for real-world search terms, test new boards, or consider adding AI sourcing tools to your tech stack.
Metric #2: Time to Screen
The number of days between receiving an application and booking the first screening interview tells you a lot about your hiring engine: how quickly teams can review applications, how aligned recruiters and hiring managers are on decisions, how easy (or not) it is to find time on packed calendars, and whether your applicant tracking system supports faster screening.
By the Numbers

What’s Happening
This year, screening times improved across all company sizes and industries—a clear sign that teams are prioritizing responsiveness and tightening workflows.
Like last year, enterprises continue to have the fastest time to screen (5.7 days), showing that scale doesn’t have to slow things down. When systems, automation, and hiring teams are in sync, even the most complex organizations can move quickly.
Industry trends reflect the realities of the work itself. Hospitality leads (6.5 days), likely because these teams are often managing high-volume hiring surges—think summer travel or holiday seasons—and have built a muscle for fast decision-making. Software & tech stretch higher to 9 days, with roles that typically require more touchpoints, deeper evaluations, and stronger cross-functional alignment before moving candidates forward.
What to Do Next
- If your time is long: Find the bottlenecks—slow responses, too many unqualified applicants, or manual steps—and fix them with automation, clear SLAs, and stronger recruiting software workflows
- If your time is short: Keep it up but make sure speed isn’t sacrificing thoroughness. Maintain consistent evaluation criteria, so every candidate gets a fair and informed review.
Metric #3: Interview-to-Offer Rate
A high interview-to-offer rate means your team is only bringing the right candidates into the interview stage. It signals strong screening up front: filters that are working, misfits getting weeded out early, and interview time spent where it matters most, often supported by interview intelligence tools
By the Numbers

What’s Happening
Enterprises stand out with a 72.2% conversion rate, showing the impact of strong alignment and disciplined funnel management. These teams typically move fewer candidates to interview, but those candidates are already well-vetted, so most conversations end in a confident yes.
Mid-market (16.6%) and small businesses (7.0%), on the other hand, often cast a wider net. This strategy can bring in great talent, but it also leads to more interviews that don’t convert, especially if hiring criteria shift midway through the process or feedback loops are inconsistent.
By industry, retail roles see higher conversion (39.3%) because teams are often hiring for the same or similar skill sets on repeat. Over time, recruiters build a sharp instinct for spotting strong matches early, which naturally boosts conversion down the line. Tech (14.8%) and business services (10.8%) sit on the other end of the spectrum. These roles vary widely in scope and skill requirements, making upfront alignment harder, so teams may need to interview more candidates before finding the right fit.
What to Do Next
- If your rate is low: Revisit screening criteria to ensure only top matches reach interviews. Train interviewers to spot “hireability” early and give structured feedback fast. If strong candidates still aren’t converting, look for late-stage gaps like compensation or title misalignment.
- If your rate is high: Now’s the time to stress-test that process for inclusivity. Make sure a strong conversion rate doesn’t come at the expense of diversity by auditing whether you’re consistently interviewing candidates from different backgrounds and experiences.
Metric #4: Offer Acceptance Rate
The percentage of candidates who accept an offer shows how compelling your hiring process is—and how your offer measures up against competitors.
By the Numbers

What’s Happening
Mid-market (89.8%) and small businesses (83.9%) have slightly higher acceptance rates than enterprises (81.5%). By industry, manufacturing (91%) and hospitality (90%) lead, while software & tech sit lower at 80.8%.
While this data doesn’t tell us exactly why candidates say no, our 2025 Job Seeker Nation Report offers some clues. Of the 23% of job seekers who declined an offer last year, nearly 40% cited limited career growth or the wrong location, about a third walked away due to rigid remote-work policies, and roughly 20% pointed to a poor interview experience or negative perceptions of company culture.
What to Do Next
- If your rate is low: Look for red flags in your process—unclear timelines, slow responses, or inconsistent interviews. Then audit your offer: how do your organization’s pay, flexibility, and benefits stack up. For deeper insights, check the Job Seeker Nation Report.
- If your rate is strong: Learn why candidates say yes. Ask what sealed the deal—experience, culture, growth—and double down on the moments that make your offer irresistible.
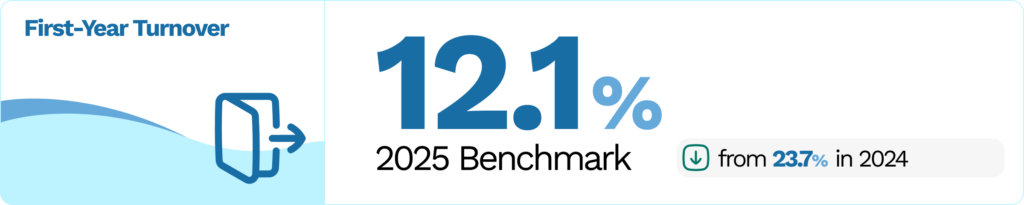
Metric #5: First-Year Turnover
The percentage of employees who leave within their first year is your best indicator of how well your hiring process transitions new talent from “you’re hired” to truly feeling at home—and whether your hiring software, interview process, and onboarding strategy are setting them up for success.
By the Numbers*
*This benchmark reflects Employ’s internal data
What’s Happening
First-year turnover dropped steeply to just 12.1%—almost half of last year’s rate. That’s a sign teams are getting onboarding right. Even more encouraging, 95% of new hires now rate their experience positively. When early retention is high, it usually means new employees feel supported, connected, and confident about how to grow in their roles from day one.
What to Do Next
- Start before day one: Reach out before their start date with a warm welcome, key resources, and pre-read materials. Encourage teammates to do the same—a personal touch sets the tone for belonging.
- Keep momentum: Build a clear 30-60-90 plan and schedule regular check-ins. Early clarity and consistent support are two of the strongest predictors of long-term success.
What This All Means for You
Looking across these five stages, a few patterns jump out:
1. Speed and personalization aren’t rivals—they’re partners. The best teams are moving fast while still treating people like humans, not just requisitions to fill.
2. The gap between enterprise and smaller organizations often comes down to resources, not strategy. With more tools, tech, and team capacity, enterprises can move candidates through the funnel quickly and consistently. Smaller teams are just as committed, but without the same support behind the scenes, it’s harder to see the same gains. That’s where AI recruiting software becomes a real equalizer—42% of recruiters say it’s already reducing stress and busy work.
3. Your data is telling a story. Whether it’s about candidate experience, hiring team alignment, or the speed and consistency of your process, the signals are there. Listen to what the numbers reveal, then identify the process improvements or tech investments —like recruiting technology or stronger talent acquisition strategies—that can relieve bottlenecks and strengthen what’s already working.
The teams moving the needle in 2026 won’t be the ones trying to do everything. They’re picking one or two critical gaps—maybe it’s time to fill, maybe it’s candidate experience, maybe it’s offer acceptance rate—and actually fixing it. Then they measure the results. And then they move to the next thing.
Next Step? Download the 2025 Hiring Benchmarks Report
What I’ve covered here is only the tip of the iceberg. If you want to go further and see exactly where your team stands, I encourage you to download the full Employ Hiring Benchmarks Report.
Inside, you’ll find data broken down by company size and industry, more key metrics, and detailed benchmarks—plus actionable recommendations for every stage of your process. It’s your roadmap to hiring smarter, faster, and with greater confidence in 2026.
Prefer a guided walkthrough of how our tools can help your team hit or surpass these benchmarks? Request a demo with one of our product experts.